Area
The Area represents the spatial environment of the survey. It sets the spatial bounds of the survey so it should be the first building block defined. All of the methods used to generate Layer and Coverage blocks will require the Area as an input parameter.
Creating an Area
There are three main ways to create an Area.
from a
shapelyPolygonfrom a shapefile
from a value specifying the resulting area
We will take a look at examples of all three. First, let’s import prospect as prospect.
import prospect
From a shapely Polygon
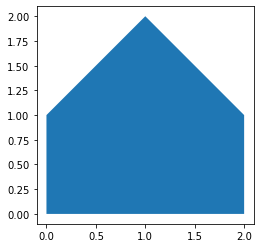
We can create an Area from any shapely Polygon object. Let’s create a fairly simple polygon (a pentagon) and use it to create an Area.
from shapely.geometry import Polygon
pentagon = Polygon([(0, 0), (2, 0), (2, 1), (1, 2), (0, 1)])
area_shapely = prospect.Area(name='from shapely rectangle', shape=pentagon, vis=1.0)
Area objects have the following attributes: name, shape, vis, and df.
area_shapely.name
'from shapely rectangle'
area_shapely.shape

area_shapely.vis
1.0
area_shapely.df
| name | shape | vis | |
|---|---|---|---|
| 0 | from shapely rectangle | POLYGON ((0.00000 0.00000, 2.00000 0.00000, 2.... | 1.0 |
Of these, df is the most useful because it is a geopandas GeoDataFrame containing all of the other values.
geopandas provides some plotting options for GeoDataFrame objects, so we can visually examine the resulting Area in a matplotlib plot by calling the plot() method on the df attribute.
area_shapely.df.plot()
<AxesSubplot:>
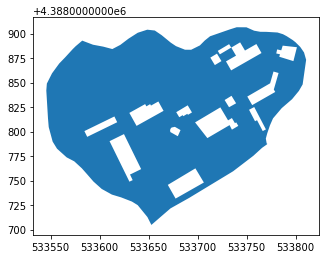
From a shapefile
Caution
If the shapefile contains more than one polygon, only the first polygon will be used. If you want to create an Area by combining multiple polygons, you will first have to dissolve them into a single polygon.
area_shp = prospect.Area.from_shapefile(name='from shapefile', path='./data/demo_area.shp', vis=1.0, encoding="utf-8")
area_shp.df.plot();
Note
prospect has no difficulty dealing with polygons that have interior holes.
From an area value
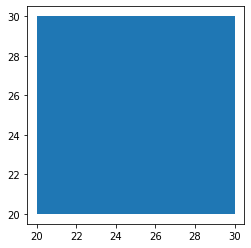
The final way to construct an Area object is to create a square by specifying a desired area value and an origin. This is intended to be a convenient method for use in building hypothetical surveys. The following creates an Area with an area of 100.0 sq. units with a lower left corner at (20, 20).
area_value = prospect.Area.from_area_value(
    name='from value',
    value=100.0,
    origin=(20.0, 20.0),
    vis=1.0
)
area_value.df.plot()
<AxesSubplot:>
The vis parameter
Besides defining the spatial extent of the survey, the Area also defines the surface visibility parameter of the simulation. Like all parameters, the surface visibility can be defined with a single probability value or as a scipy.stats distribution. (In the future, I hope to add additional support for a raster “surface” of visibility.)
If a single value is inappropriate for your case, surface visibility can be modeled in a variety of ways. Both a truncated normal distribution (constrained between 0 and 1) and a Beta distribution could be good options. In the case of the Beta distribution, the following heuristic can be helpful:
If \(n\) artifacts were placed in a subset of that
Area, how many artifacts, \(v\), would be visible to the surveyor, assuming a perfect ideal observation rate of 1.0 and a perfect surveyor skill of 1.0?
In that case, \(\alpha = v\) and \(\beta = n - v\).
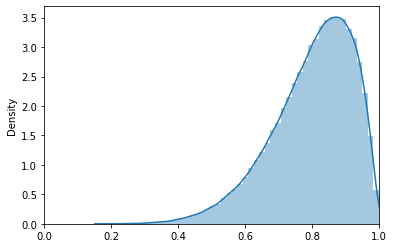
For example, if you placed 10 artifacts in an area and expected 8 to be visible, you could create a Beta distribution like this.
from scipy.stats import beta
vis_dist = beta(a=8, b=2)
And now let’s examine the shape of that distribution.
Attention
seaborn, used here for plotting, is not a dependency of prospect so you may not have it installed.
import seaborn as sns
hist_8_2 = sns.distplot(vis_dist.rvs(100000))
hist_8_2.set_xlim(0,1);
/usr/share/miniconda/envs/prospect-docs/lib/python3.8/site-packages/seaborn/distributions.py:2619: FutureWarning: `distplot` is a deprecated function and will be removed in a future version. Please adapt your code to use either `displot` (a figure-level function with similar flexibility) or `histplot` (an axes-level function for histograms).
  warnings.warn(msg, FutureWarning)